
What Great Salt Lake is
“Great Salt Lake” is the federally recognized name; the GNIS record is feature 1441459. This page covers the modern lake, including its connected arms and marginal bays. It does not use the name for the wider 21,500 mi² watershed, the much larger prehistoric Lake Bonneville, or the Great Salt Lake Desert west of the modern water body.[1][2]
The lake lies at the eastern edge of the hydrographic Great Basin, immediately west and northwest of the Wasatch Front urban corridor. The Wasatch Range rises east of the lake; the Oquirrh Mountains stand along its southeastern side; and lower desert basins and the Great Salt Lake Desert extend west. These physical boundaries matter more to the water system than county lines: runoff descends from mountain catchments into a closed basin and ultimately evaporates at the lake floor.[2]
Fault-bounded relief beneath a very shallow lake
Crustal extension in the Basin and Range province produced north–south fault-bounded ranges beside subsiding valleys. Great Salt Lake occupies a low part of that tectonic terrain, but it is not one simple bowl. Bedrock highs rise through the lake as Antelope, Stansbury, Fremont, Carrington, and smaller islands; whether some remain true islands or become peninsulas changes with lake stage.[2]
At the traditional 4,200 ft reference elevation, the Utah Geological Survey gives an area of about 1,600 mi² (4,140 km²), an average depth of 14 ft (4.3 m), and a maximum depth of 33 ft (10 m). These are stage-specific values, not permanent dimensions. The agency estimates that a 1 ft (0.30 m) level change inundates or exposes roughly 70 mi² (180 km²) of lakebed because so much of the margin has an extremely low gradient.[2]
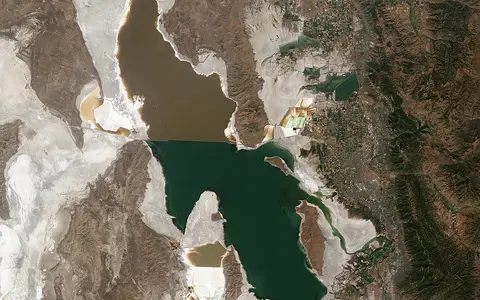
The main open-water sectors are Gunnison Bay, or the north arm, and Gilbert Bay, or the south arm. Bear River Bay lies to the northeast and Farmington Bay to the southeast. Antelope Island separates part of Gilbert Bay from Farmington Bay, while Promontory Point projects toward the railroad causeway from the north. These names describe connected physical sectors, not separate lakes.[2]
From Lake Bonneville to a terminal salt lake
During the last glacial period, cooler and wetter conditions allowed freshwater Lake Bonneville to occupy much of western Utah and parts of present-day Idaho and Nevada. It rose to an outlet at Red Rock Pass, then fell after outlet incision and later contracted as the regional water balance became warmer and drier. A scientific synthesis places the end of Lake Bonneville and the beginning of the Great Salt Lake system at about 13,000 years before present.[3]
The modern lake is therefore a successor to Lake Bonneville, not simply the last unchanged pool of it. Bonneville shore terraces and lake sediment remain around the basin, while removal of the former lake's water load caused uneven isostatic rebound—slow crustal rise after unloading. Consequently, a single ancient shoreline is now at different elevations around the basin.[2]
Basin and Range
Crustal extension formed alternating ranges and basins before the modern lake.
Lake Bonneville
A large late-Pleistocene freshwater lake occupied a much greater part of the basin.
About 13,000 years
The post-Bonneville lake has repeatedly risen and fallen; it has no single natural “normal” shore.
Inflow without an ocean outlet
Runoff from the Uinta Mountains, Wasatch Range, and Bear River Range reaches Great Salt Lake mainly through the Bear, Weber, and Jordan rivers. The Jordan drains north from Utah Lake before entering Farmington Bay. Utah Geological Survey accounting attributes roughly 70% of lake input to the three principal rivers, including nearly 40% to the Bear River alone; direct precipitation supplies about 30%, with groundwater and intermittent West Desert streams providing a small remainder.[2]
No river carries water or dissolved salts onward to the ocean. Water leaves chiefly by evaporation; salts delivered by streams remain in the basin or precipitate into sediment as brine becomes concentrated. Snowmelt commonly lifts lake level in spring and early summer, while evaporation usually drives a seasonal fall toward October or November. Multi-year wet and dry sequences are superimposed on that annual cycle.[2]
One lake, two strongly contrasting arms
A rock-fill railroad causeway built from 1957 to 1959 restricts circulation between Gunnison Bay and Gilbert Bay. Because almost all river water enters south of it, the south arm is generally higher and less saline. The denser north-arm brine can move south at depth while lighter south-arm water moves north near the surface, creating a deep brine layer in parts of the south arm.[2]
Salinity is variable, so a single percentage should not describe the whole lake. The Utah Division of Wildlife Resources' July 2026 overview reports typical averages of about 12–15% by mass in the south arm and 26–30% in the north arm. Fresh runoff dilutes brine and low lake volume concentrates it; the causeway superimposes restricted exchange on those natural water-balance changes.[7]
Engineered openings have changed through time. The latest breach was completed in 2016, and a control berm there was raised to 4,192 ft NGVD29 in February 2023 to retain more freshwater in the south arm. The causeway is therefore not a sealed dam: flow through the breach and porous fill continues, but its geometry materially controls salt and water exchange.[6]
Stage, area, and volume must be read together
The south-arm gauge reached 4,211.60 ft above NGVD29 on 3 June 1986 and a record low of 4,188.5 ft on 7 November 2022. USGS Landsat interpretation places the lake at about 2,300 mi² (5,960 km²) near the 1986 high and below 1,000 mi² (2,590 km²) in 2022. Those areas are dated observations, not competing estimates of a fixed lake size.[4]
A 2023 USGS topobathymetric dataset provides area and volume at 0.01 ft elevation increments for the whole lake and separately for the north arm, south arm, Bear River Bay, and Farmington Bay. It combines 2005–06 bathymetry with 2016 lidar and reports elevation in NAVD88. Historic gauge values on this page use NGVD29; the numbers should not be compared or merged without a vertical-datum transformation.[5]
Climate and water use operate at different time scales. A 2025 mass-balance study found that cumulative low streamflow contributed nearly three times as much as rising evaporation to the modeled departure from its selected 1951–77 equilibrium volume by 2022, although rising evaporation was also necessary to reach the record low. Separately, a 2017 water-balance analysis estimated that consumptive use had lowered the lake by about 11 ft (3.4 m) relative to a no-use simulation since 1847. Both are model-based attributions, not direct measurements of a single cause.[8][9]
A lake within, but smaller than, the Bonneville system
Great Salt Lake is one terminal water body within the broader Bonneville Basin. Utah Lake, Sevier Lake, the Great Salt Lake Desert, and the Bonneville Salt Flats preserve other parts of the late-Pleistocene lake system, but they are not arms of the modern lake. Follow the adjacent dry basin westward on the Great Salt Lake Desert page, or compare enclosed-lake behavior through the Caspian Sea and Lake Eyre records.
Sources and measurement notes
- U.S. Geological Survey and U.S. Board on Geographic Names, Geographic Names Information System feature record 1441459, “Great Salt Lake”, via The National Map Gazetteer (data refreshed July 2026; accessed 29 August 2026). GNIS coordinates for an areal feature locate its approximate centre and use NAD83.
- Utah Geological Survey, “Commonly Asked Questions About Utah's Great Salt Lake & Lake Bonneville” (accessed 29 August 2026). Source for Basin and Range setting, tributary shares, 4,200 ft reference dimensions, shoreline sensitivity, islands, salinity processes, and Lake Bonneville context.
- Oviatt, C. G., Atwood, G. & Thompson, R. S., “History of Great Salt Lake, Utah, USA: Since the termination of Lake Bonneville” (2021), doi:10.1007/978-3-030-66576-0_8. Source for the approximately 13,000-year transition and limits on reconstructing a precise post-Bonneville hydrograph.
- U.S. Geological Survey, Utah Water Science Center, “Great Salt Lake Elevations and Areal Extent” (active monitoring page, accessed 29 August 2026). Source for gauge history, 1986 and 2022 south-arm records, and dated Landsat area estimates; elevations are NGVD29.
- Root, J. C. et al., U.S. Geological Survey, “Half-meter topobathymetric elevation model and elevation-area-volume tables for Great Salt Lake, Utah, 2002–2016” (2023 data release). Area-volume tables are derived from a 5 m resampling of combined bathymetry and lidar and use NAVD88.
- Root, C. et al., U.S. Geological Survey, “Topobathymetric elevation model of the causeway breach, Great Salt Lake, Utah,” version 2.0 (January 2026), doi:10.5066/P14VFC9J. Source for causeway dates, the 2016 breach, and berm elevations.
- Utah Division of Wildlife Resources, Great Salt Lake Ecosystem Program, “About the Great Salt Lake” (updated 31 July 2026), and Office of the Great Salt Lake Commissioner, “Current Conditions” (updated 27 July 2026). Sources for typical north- and south-arm salinity ranges and the percent-by-mass convention.
- Bigalke, S. et al., “Explaining the 2022 Record Low Great Salt Lake Volume”, Geophysical Research Letters 52 (2025). Source for the 1950–2022 mass-balance attribution and its equilibrium-period assumptions.
- Wurtsbaugh, W. A. et al., “Decline of the world's saline lakes”, Nature Geoscience 10 (2017), 816–821. Source for the modeled long-term effect of consumptive water use on lake elevation and volume.