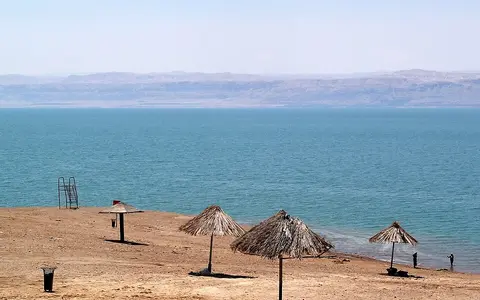

The active lake, not every feature called “Dead Sea”
Dead Sea is the conventional English name for this international feature. The local names recorded by the UK Permanent Committee on Geographical Names are Arabic Al Baḩr al Mayyit (البحر الميت) in Jordan and Palestine and Hebrew Yam HaMelaẖ (ים המלח) in Israel. Its 31°30′ N, 35°30′ E coordinate is a label position for the water body; a lake whose shoreline retreats cannot be represented by one point.[1]
This page covers the natural standing-water body in the deep northern basin and the immediate submerged basin form. Since the natural shallow southern basin separated as the lake fell in 1979, engineered ponds have occupied parts of its exposed floor. Brine is pumped south and concentrated end brine is returned north, so the ponds affect the lake's water and salt budgets, but they are not the present natural lake.[3][6]
Dimensions need the same boundary discipline. A recent synthesis describes the active northern lake as about 50 km long and up to 15 km wide; its 2022 Landsat-derived area was 592.3703 km². The Dead Sea pull-apart basin, by contrast, extends more than 150 km along the transform and is up to 15–17 km wide. The hydrological catchment is larger again—about 43,000 km² in the Geological Survey of Israel's 2015 analysis.[3][4][5]
A narrow lake between steep desert escarpments
The lower Jordan River reaches the lake's northern end after descending through the Jordan Valley from the Sea of Galilee. The Judean Mountains and Desert rise west of the lake; eastward, the Jordanian plateau is cut by deeply incised drainage such as Wadi Mujib. At the southeast margin, the Lisan Peninsula projects toward the former sill between the deep north and shallow south. Beyond the exposed southern floor, the Araba Valley rises toward the drainage divide that prevents any natural connection with the Gulf of Aqaba.[1][3]
The valley cross-section is strongly asymmetric. Fault scarps and uplifted flanks confine the narrow basin, and the eastern relief is generally higher. Short western wadis descend rapidly across bedrock and alluvial fans; larger eastern catchments cut canyons through the plateau. These slopes deliver both groundwater and episodic floodwater to a lake surface more than 440 m below mean sea level.[5][9]
A deep northern trough and an exposed southern floor
The northern lake is not a flat-bottomed salt pan. A 2006–2007 multibeam survey collected 40.5 million soundings and produced a 5 m bathymetric grid after correcting for unusually high sound speed, beam refraction, groundwater-discharge effects, and salt accumulating on the instrument. The mapped bed reaches approximately 730 m below sea level.[3]
Subtracting the official 1 July 2026 surface elevation (−441.00 m) from that mapped bed elevation gives a present maximum water-column depth of roughly 289 m, rounded here to about 290 m. This is an inference across two survey dates, not a new sounding: the lake surface has continued to fall, while halite deposition can raise parts of the bed. Older values around 300–305 m correctly describe an earlier, higher lake and should retain their survey dates.[2][3][6]
Active terminal lake
The deep natural water body, approximately 50 km long and 15 km at its widest in the cited modern description.
Former connection
The Lisan Peninsula and shallow sill mark the transition where falling water separated the two basins.
Managed ponds
Levees, pumping, and canals maintain industrial evaporation ponds on the former shallow lake floor.
A pull-apart within a transform boundary
The Dead Sea Transform accommodates left-lateral motion between the Arabian Plate on the east and the Sinai–African side on the west. At the Dead Sea, offset strike-slip strands—the Jericho fault to the west and Arava fault to the east—created space for crust to subside between them. Geologists call the result a pull-apart basin: an elongate depression opened where laterally moving fault segments step apart.[5]
The transform began about 15 million years ago, while the main subsidence phase of the present Dead Sea basin is placed around 5 million years ago. Seismic and gravity evidence indicates that the structural depression reaches at least 8.5 km to basement beneath its central part. Most of that depth is filled with sediment and evaporites; the modern lake is only the uppermost water-filled portion of a much older basin.[5]
A 43,000 km² catchment with no outlet
The drainage basin includes the Jordan–Yarmouk system to the north, direct western catchments, eastern plateau catchments, and the arid Araba drainage to the south. The 2015 Geological Survey analysis assigns about 45% of the total catchment area to the Jordan and Yarmouk, but their importance is greater than area alone suggests because their headwaters receive substantially more rain. Wadi Mujib and Wadi Wala are major eastern contributors; short western wadis, springs, and groundwater enter along the opposite margin.[3]
Evaporation is the only large natural loss from the terminal lake. A mass-and-energy balance using 1996–2001 buoy and meteorological observations estimated total annual inflow at 265–335 million m³ and evaporation equivalent to 1.1–1.2 m of lake depth per year. Those values describe that observation period, not an invariant modern budget. The same analysis estimated roughly 250 million m³ per year of additional net water loss through industrial pumping to the southern ponds after concentrated return brine was accounted for.[6]
Upstream diversion and impoundment sharply reduced water formerly supplied by the lower Jordan and eastern tributaries. The 2015 Geological Survey analysis found no significant four-decade decline in basin precipitation that could explain the accelerating lake-level fall; it instead attributed the changing winter signal mainly to reduced runoff reaching the lake. Industrial evaporation remains an additional loss, but the report did not find increasing summer industrial use or direct lake evaporation to be the cause of the acceleration it measured.[3]
A shoreline defined by measurement date
The Israel Water Authority's monthly series reports the lake surface at −441.00 m on 1 July 2026. A level without a date is misleading here: seiches produce centimetre-scale daily movement, winter floods can briefly slow or reverse decline, and the longer water deficit moves the mean shoreline downslope. The 2015 technical report describes the monthly gauge measurements as accurate to about 2 cm, comparable to the lake's within-day oscillation.[2][3]
Area changes with both water level and the boundary mapped. A 2026 remote-sensing study manually digitized the water edge on geometrically aligned Landsat images and reported 592.3703 km² for 2022, down from 684.6158 km² in its 1984 image. These are image-date surface outlines of the active water body, not a constant catalog area and not the area of the catchment or structural basin.[4]
Concentration, seasonal layering, and salt deposition
“Salinity” values for the Dead Sea can appear contradictory because authors use mass per mass, mass per volume, density-based “quasi-salinity,” or individual-ion concentrations. A 2005 water-balance study reported approximately 277 g of dissolved salts per kilogram of brine and a density near 1,240 kg/m³ at 23°C. Those values describe the composition used in that study; continued water loss and mineral precipitation mean they should not be presented as permanent constants.[6]
Modern circulation is usually seasonal. Surface heating and evaporation build a warm, saltier upper layer; cooling later weakens the density structure and can mix the water column. High-resolution observations found salt-finger convection across the transition layer and continuing halite—sodium chloride—crystallization in deep water. This is why the Dead Sea is not simply “water evaporates and all salts remain dissolved”: some minerals precipitate and become new lake-floor sediment.[7]
Very little shore rain, but efficient flood delivery
The lake floor lies in a hot, arid rain shadow, while higher parts of its catchment intercept more winter precipitation. At Sedom near the southern basin, the Israel Meteorological Service gives a 1991–2020 mean annual rainfall of 39 mm. That station normal represents one low, southern site rather than the whole catchment; the Judean and Jordanian uplands receive far more water and generate much of the runoff that reaches the depression.[10]
Direct evaporation also needs a site and period. Eddy-covariance measurements at the western shore from March 2014 to March 2015 yielded 994 ± 88 mm for the year at that location. Evaporation varied with water-vapour deficit and three local wind systems: daytime lake breeze, evening downslope winds, and nocturnal northerly flow. Short cool-season storms can meanwhile produce flash floods because steep, sparsely vegetated wadis transfer runoff and sediment rapidly to their fan mouths.[8][9]
Incision, groundwater change, and collapse
Falling base level makes tributaries cut into their older alluvial fans and leaves beach ridges, mudflats, and salt-rich lake sediment above the new shore. Groundwater responds too: the interface between Dead Sea brine and fresher water from the Judean aquifer migrates toward the retreating lake. Where undersaturated groundwater reaches a buried Holocene salt layer, it dissolves cavities that can collapse through the overlying mudflat or fan sediment.[9]
The resulting sinkholes are not distributed uniformly around every shore. The detailed 2017 study mapped them in a narrow western-shore belt and showed that buried-salt depth, faults, sediment type, groundwater supply, and rainfall in the distant recharge area all affect where and when collapse occurs. Lake-level decline is the necessary regional trigger, but local groundwater and subsurface geology control the pattern.[9]
The remnant of larger terminal lakes
The present Dead Sea is not the full extent of its late-Quaternary predecessors. Lake Lisan extended north toward the Sea of Galilee and left shoreline deposits far above the modern water. A 2024 synthesis places the transition from Lake Lisan to the Holocene Dead Sea between about 15,000 and 10,000 years ago, with an approximately 200 m fall interrupted by substantial fluctuations. The modern shoreline therefore occupies one low stand within a long sequence of climate-sensitive terminal lakes.[11]
From Jordan drainage to transform relief
The Dead Sea belongs in the lake hub as an endorheic hypersaline lake, while its principal inflow places it within the river systems hub. Its fault scarps, submerged basin, alluvial fans, wadis, mudflats, and sinkhole terrain connect it to the terrain index. Those links provide wider regional context without expanding this record's scope beyond the lake and its immediate physical basin.
Sources and measurement notes
- UK Permanent Committee on Geographical Names, Toponymic Factfile: Jordan, updated November 2025, pp. 7–9 (accessed 29 August 2026). Source for the conventional English name, Arabic and Hebrew names, representative coordinate, Wadi Mujib name, and the modern scope of “Araba Valley.” The coordinate is a label position for an international feature.
- Israel Governmental Authority for Water and Sewerage, Hydrological Service, Dead Sea Level Since 1976, official monthly dataset, updated 24 July 2026 (accessed 29 August 2026). Source for the −441.00 m reading dated 1 July 2026. The page reports negative metres relative to sea level; the figure is a dated water-surface elevation, not lake depth.
- Lensky, N. and Dante, E., Geological Survey of Israel, Factors Affecting the Accelerated Decline of the Dead Sea Level in Recent Decades, report GSI/16/2015 (2015; Hebrew with English references; accessed 29 August 2026). Source for the roughly 43,000 km² catchment, sub-basin shares, 1979 north–south separation, monthly-level precision, causes of accelerated decline, and the 2007 multibeam bathymetry and hypsometry. The report notes that near-shore elevations around the survey's −420 m waterline combine sonar and terrestrial interpolation.
- Farhan, I. et al., “Multi-Decadal Assessment of the Surface Area and Water Levels of the Dead Sea Using Remote Sensing Data”, Water 18, 1537 (2026). Source for the approximately 50 km by 15 km active northern-basin dimensions, Landsat boundary method, and 592.3703 km² area in 2022. The area is an image-derived snapshot; this page does not use the paper's modelled future levels as measurements.
- Smit, J. et al., “Pull-apart basin formation and development in narrow transform zones with application to the Dead Sea Basin”, Tectonics 27 (2008). Source for plate-boundary setting, Jericho and Arava fault strands, staged transform and basin development, steep asymmetric relief, and the structural basin's more-than-150 km length, 15–17 km width, and at-least-8.5 km depth to basement. Those are dimensions of the sedimentary basin, not of the modern lake.
- Lensky, N. G. et al., “Water, salt, and energy balances of the Dead Sea”, Water Resources Research 41 (2005). Source for terminal-lake hydrology, 1996–2001 balance method, 265–335 million m³ annual inflow, 1.1–1.2 m annual evaporation estimate, approximately 250 million m³ industrial net loss, time-specific brine salinity and density, earlier 2005 area, volume, depth and level, southern ponds, and salt precipitation. This page does not reuse the 2005 geometry as if current.
- Arnon, A., Selker, J. S. and Lensky, N. G., “Thermohaline stratification and double diffusion diapycnal fluxes in the hypersaline Dead Sea”, Limnology and Oceanography 61, 1214–1231 (2016). Source for observed seasonal layering, salt-finger mixing, and halite crystallization in the deeper water.
- Metzger, J. et al., “Dead Sea evaporation by eddy covariance measurements vs. aerodynamic, energy budget, Priestley–Taylor, and Penman estimates”, Hydrology and Earth System Sciences 22, 1135–1155 (2018). Source for the March 2014–March 2015 western-shore measurement of 994 ± 88 mm, its location and period limits, and the observed daily wind controls.
- Abelson, M. et al., “Natural versus human control on subsurface salt dissolution and development of thousands of sinkholes along the Dead Sea coast”, Journal of Geophysical Research: Earth Surface 122, 1262–1277 (2017). Source for the western-shore sinkhole distribution, base-level incision, groundwater-interface migration, buried-salt dissolution mechanism, alluvial-fan and mudflat differences, and rainfall influence from the Judean recharge area.
- Israel Meteorological Service, Rainfall Intensities in Israel, Sedom station sheet, p. 78 (2024 edition; accessed 29 August 2026). Source for station coordinates, −388 m station elevation, 1962–2022 activity period, and 39 mm mean annual rainfall for the 1991–2020 normal period.
- Jara-Muñoz, J. et al., “Unveiling the Transition From Paleolake Lisan to Dead Sea Through the Analysis of Lake Paleoshorelines and Radiometric Dating of Fossil Stromatolites”, Geochemistry, Geophysics, Geosystems 25 (2024). Source for the distinction between Lake Lisan and the present Dead Sea, the approximately 15–10 ka transition, and the roughly 200 m fall. The figures describe a multi-millennial transition, not the modern instrumental decline.
- Hall, J. K., “Digital topography and bathymetry of the area of the Dead Sea Depression”, Tectonophysics 266, 177–185 (1996). Source for the global lowest-continental-feature comparison, the northern basin's approximately 50 km length and 13–17 km width at the survey epoch, and the digital terrain model's bed elevation of −731 m. Its quoted lake surface of about −409 m is historical and is not used as a current level.