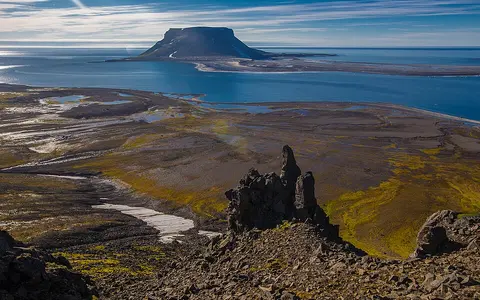

What the name covers
“Arctic Desert,” “Arctic polar desert,” and “High Arctic polar desert” are overlapping descriptive names. This record uses them for terrestrial High Arctic surfaces whose combination of low moisture supply, low summer warmth, and sparse cover produces polar-desert terrain. It excludes the Arctic Ocean and sea ice because they are marine, and excludes the Greenland Ice Sheet as a separate continental ice-sheet system. Glaciers and small ice caps are discussed where they form part of the land surface and control relief or drainage.
No single coordinate can represent this ring of separated islands and coasts. Boundaries also depend on the mapping rule. The approximately 1.2-million-km² estimate uses paired precipitation and July-temperature thresholds.[1] The 2024 Raster Circumpolar Arctic Vegetation Map instead divides tundra north of the tree line by vegetation and summer warmth. Its coldest subzone A has a summer warmth index below 6°C—the sum of monthly mean temperatures above freezing—and typically less than 5% vascular-plant cover, although mosses and lichens may cover more ground.[2] A climatic desert polygon and a vegetation subzone therefore should not be presented as the same area.
“Desert” here describes limited precipitation and limited available liquid water; it does not mean that every tract shares one formal climate class. Nor does bare ground alone prove climatic desert: exposed rock can also reflect steep relief, young glacial deposits, wind scour, or substrate chemistry.
Land around several Arctic seas
The largest connected groups lie in the Queen Elizabeth Islands of the Canadian Arctic Archipelago, including northern Ellesmere and Axel Heiberg islands. Eastward across Nares Strait, polar-desert and ice-covered terrain continue along the ice-free margins of northern Greenland. Across the Greenland Sea, High Arctic conditions recur in northern and eastern Svalbard; farther east they appear on Franz Josef Land, Novaya Zemlya, Severnaya Zemlya, and smaller Russian islands bordering the Barents, Kara, and Laptev seas. The circumpolar vegetation map shows the overall distribution but, at 1-km raster resolution, is intended for regional rather than site-scale boundaries.[2]
These tracts do not form a latitude-bounded belt. Northern Ellesmere includes the Arctic Cordillera, deep fiords, plateaus, lowlands, and land ice, whereas other sectors are low islands, sedimentary plateaus, or glaciated archipelagos. Quttinirpaaq National Park on northern Ellesmere is a concrete example of the mountain–ice-cap–barren-tundra combination, while its Lake Hazen basin is a warmer local “polar oasis” within the wider dry landscape.[4]
Ocean exposure helps explain the patchwork. The central Canadian archipelago is cold and continental, while North Atlantic-facing terrain is generally wetter and more maritime. Persistent coastal sea ice can keep summer air cold; seasonally open water can add cloud and moisture. Elevation, windward uplift, rain shadows, and local snow redistribution can therefore move a polar-desert boundary independently of latitude.[1][3]
Inherited rock, then ice and frost
The Arctic Desert has no single bedrock age or tectonic origin. Northern Ellesmere contains rugged sedimentary mountains and fiords within the Arctic Cordillera, while Svalbard exposes metamorphic basement, younger sedimentary cover, and Quaternary deposits. In western Spitsbergen, North Atlantic opening about 60–40 million years ago folded a mountain belt; farther east, flatter sedimentary structures and resistant dolerite or basalt help form plateaus and ridges.[4][5]
Repeated Quaternary glaciations cut troughs and fiords, widened valleys, and left moraines, outwash, and thin glacial drift. Some uplands still carry ice caps whose outlet glaciers descend toward marine inlets; other ground remained or became ice-free because snowfall was too limited to sustain continuous land ice. After deglaciation, removal of ice load allowed land to rebound. The Norwegian Polar Institute reports former shorelines in Svalbard now 40–80 m above present sea level; that is a regional relative-sea-level range, not a uniform uplift value for the Arctic Desert.[5]
On exposed surfaces, frost cracking produces angular talus and block fields. Freeze–thaw movement and ground-ice growth sort fine and coarse material into circles, stripes, and polygons. These are periglacial landforms—features made by freezing processes outside or beside glaciers—not evidence that every surface was recently glaciated. Wind removes snow from ridges and deposits it in lee hollows, reinforcing the contrast between bare fellfield, late snowbeds, and locally wetter ground.
Cordillera and fiords
Northern Ellesmere combines mountains, deep marine inlets, ice caps, and glacially excavated valleys.
Layered and volcanic caps
In Svalbard, sedimentary structure and resistant intrusions or lava locally control cliffs, tablelands, and ridges.
Terraces and frost ground
Raised beaches, marine sediment, outwash, and patterned ground organize many coastal plains and interior lows.
Permafrost is structure, not scenery
Permafrost is ground that remains at or below 0°C for at least two consecutive years; it may be bedrock, sediment, or soil and may contain little or abundant ice. Above it, the active layer thaws each summer and refreezes in winter. Because vegetation and organic soil are thin or absent across much polar-desert ground, air temperature, snow depth, surface material, slope direction, and moisture strongly influence thaw depth.
The Fosheim Peninsula on central Ellesmere shows why measurements must stay local. Its Eureka Sound Lowlands are mostly below 300 m above sea level, with bedrock ridges reaching about 840 m. In the cited study area, continuous permafrost was estimated to be about 500 m thick, while the active layer averaged 60 cm and ranged from 30 to 100 cm. Ice-rich silty-clay marine sediment dominated roughly 60% of the surface below about 150 m elevation.[6] Those values describe one surveyed lowland; rocky uplands and other Arctic archipelagos differ.
Thermal contraction cracks can fill repeatedly with meltwater that freezes into wedge-shaped bodies of ground ice. The same Fosheim study estimated that ice-wedge polygons may occur across about 3,000 km², roughly half of the peninsula, and modelled wedge ice as 3.81% of the upper 5.9 m of permafrost in mapped terrain.[6] These are image-based and subsurface-model estimates, not direct measurements beneath every polygon.
A short but organized flow season
Water is stored through most of the year as seasonal snow, lake ice, ground ice, perennial snow patches, glaciers, and ice caps. Melt begins unevenly: windswept surfaces clear first, while deep lee-side drifts can release water well into summer. The frozen substrate limits deep circulation, but it does not force all water to remain visible at the surface. Flow can pass laterally through the thawed active layer, coarse frost-sorted bands, or shallow conduits before emerging downslope.
Measurements at Ward Hunt Island demonstrate this shallow network. Water tracks—preferential paths through patterned ground—carried water from hillside snowdrifts toward Ward Hunt Lake. Isotope sampling found unaltered snowmelt supplied more than 90% of water-track flow early in the melt season but less than 5% late in the season, when residual snow, soil water, and ground ice contributed more. The result is a changing mixture, not a single snowmelt pulse.[7]
Channels and ponds respond quickly to the energy available for thaw. Small streams may flow for weeks, carry fine sediment from glacial or frost-disturbed surfaces, then freeze or dry when melt ends. Lakes can remain ice covered for most of the year: the Norwegian Polar Institute reports typical Svalbard lake ice 1.5–2 m thick and an ice-free period of only one to two months, while noting that glacier-fed lakes receive much larger summer sediment loads.[8] These Svalbard figures illustrate one maritime sector and are not circumpolar averages.
Cold aridity with sharp local contrasts
Low precipitation results from cold air holding little water vapour, long periods of stable polar air, distance from open-water moisture, and—in some sectors—mountain barriers. NOAA's 2025 Arctic Report Card uses 250 mm or less annual precipitation as a polar-desert threshold and maps much of the Canadian Arctic Archipelago as dry, but also shows much wetter Atlantic-facing and windward terrain. Precipitation varies with storms, topographic uplift, season, and gauge limitations; 250 mm is therefore a classification rule, not an Arctic-wide mean.[3]
Coast and interior can differ over a few hundred kilometres. At Ward Hunt Island (83°05′09″ N, 74°06′19″ W), mean annual air temperature was −17.1°C and mean June–August temperature 0.4°C for 2006–2019. The same study used Alert, 170 km southeast, as the nearest precipitation analogue: 148 mm water equivalent per year for 1990–2019.[1] “Water equivalent” is the liquid depth obtained by melting rain and snow; it is not snow depth.
Farther inland at Eureka (80°00′ N, 85°55′ W), the 1980–2015 record used in a permafrost study gave 68 mm mean annual precipitation, −18.8°C mean annual air temperature, and a 6.2°C July mean.[6] That July value exceeds the <5°C criterion used for the 1.2-million-km² map, even though the field literature calls the Fosheim landscape polar desert. The difference is definitional rather than an error: one scheme requires both a cool July and low precipitation, while local landscape usage can emphasize extreme dryness, continuous permafrost, and sparse cover.
Along northern Ellesmere's coast, cold Arctic Ocean air and the Arctic Cordillera favour summer fog and low cloud and reduce melt relative to the warmer, drier interior. Wind has the opposite effect on distribution: it scours ridges, piles snow into hollows, and controls whether perennial patches gain mass. Seasonally open ocean may add moisture, whereas sea ice suppresses ocean–atmosphere heat and moisture exchange. These competing controls explain why snowfall, vegetation, active-layer depth, and glacier equilibrium lines can change over short distances.[1]
Boundaries and surfaces can move
A polar-desert boundary tied to precipitation, July temperature, or vegetation is not timeless. A different normal period can move a climatic line; a 1-km vegetation grid cannot capture every wet hollow, exposed ridge, or glacier forefield. The mapped area should therefore retain its definition and edition rather than being repeated as a permanent size for a single named object.[1][2]
Change is also physical. A longer thaw season can deepen the active layer and expose near-surface ice wedges to melting; loss of ground ice can lower the surface and reorganize ponds and drainage. Warmer or rainier late summers can extend flow after snowmelt, while shrinking glaciers or perennial snow patches change the timing and sediment content of runoff. At the coast, glacier retreat, calving, sea-ice timing, storm waves, and thawing permafrost alter shorelines by different processes, so “ice loss” and “coastal erosion” should not be treated as one measurement.
From island uplands to polar seas
The Arctic Desert belongs in the Desert Hub because low moisture supply and prolonged freezing restrict available water even where snow, ground ice, and glaciers are present. It contrasts with the Antarctic Desert: Antarctica is a continent-scale polar desert dominated by one ice sheet, whereas the northern region is separated among islands and continental margins around an ocean.
The useful physical sequence is local rather than one circumpolar drainage network: snow collects on uplands and lee slopes; summer thaw feeds active-layer flow, water tracks, streams, ponds, and lakes; glaciers send meltwater and sediment toward fiords; and coastal catchments discharge to the Arctic Ocean or its marginal seas. Southward, greater summer warmth and more continuous plant cover mark a gradual transition into tundra rather than a surveyed desert edge.
Sources and measurement notes
- Davesne, G., Fortier, D., Domine, F. & Kinnard, C., “Mass-balance and ablation processes of a perennial polar ice patch on the northern coast of Ellesmere Island”, Journal of Glaciology 69, 1598–1615 (2023). Used for the explicitly defined ~1.2-million-km² ice-free climatic area, Ward Hunt coordinates and 2006–2019 temperatures, Alert's 1990–2019 water-equivalent precipitation, and coastal climate controls.
- CAVM Team, Raster Circumpolar Arctic Vegetation Map, 1:7,000,000 poster and 1-km raster, Conservation of Arctic Flora and Fauna (2024); project documentation from the University of Alaska Fairbanks Alaska Geobotany Center (accessed 29 August 2026). Used for circumpolar distribution, map scale and resolution, subzone-A summer warmth, and cover definitions.
- Serreze, M. C. et al., NOAA, “Arctic Report Card 2025: Precipitation”, technical report OAR ARC 25-03 (2025). Used for the ≤250-mm polar-desert precipitation convention and the large Atlantic-to-interior spatial gradient; ocean precipitation shown in the report is not counted as terrestrial desert area here.
- Parks Canada, “Nature and science: Quttinirpaaq National Park” (accessed 29 August 2026). Used for the Eastern High Arctic setting, mountains, ice caps, barren tundra, and the Lake Hazen local climate contrast.
- Norwegian Polar Institute, Winfried Dallmann, “The geology of Svalbard”, with the institute's detailed geological-development record (accessed 29 August 2026). Used for bedrock provinces, North Atlantic opening, Quaternary deposits and glaciation, periglacial landforms, and the 40–80-m raised-shoreline range.
- Bernard-Grand'Maison, C. & Pollard, W., “An estimate of ice wedge volume for a High Arctic polar desert environment, Fosheim Peninsula, Ellesmere Island”, The Cryosphere 12, 3589–3604 (2018). Used for local elevations, surficial sediment, 1980–2015 Eureka climate, permafrost and active-layer thickness, ice-wedge distribution, model depth, and uncertainty.
- Paquette, M., Fortier, D. & Vincent, W. F., “Hillslope water tracks in the High Arctic: Seasonal flow dynamics with changing water sources in preferential flow paths”, Hydrological Processes 32, 1077–1089 (2018). Used for Ward Hunt snowmelt sources, shallow flow mechanisms, patterned-ground connectivity, and the measured early-to-late-season shift.
- Norwegian Polar Institute, “Arctic ecosystems in fresh water” (accessed 29 August 2026). Used only for the explicitly local Svalbard lake-ice thickness, ice-free season, and glacier-fed sediment statement.